Posts
Profiling is the first step to improving the performance of code. Suppose we want to profile the Python script below which is based on the example here. It prints out the first 20 Fibonacci numbers and is unoptimized to make the profile exaggerated.
def fib(n):
    if n == 0:
        return 0
    elif n == 1:
        return 1
    else:
        return fib(n-1) + fib(n-2)

def fib_seq(n):
    seq = [ ]
    if n > 0:
        seq.extend(fib_seq(n-1))
    seq.append(fib(n))
    return seq

print(fib_seq(20))
To generate a profile of the script, we can run the module via cProfile.
python -m cProfile -o profile.out fibonacci.py
This will generate a profile of the runtime of fibonacci.py and save it to the profile.out file. Now we need to translate the profile into a format that QCacheGrind can read. The bash script below was written by a colleague of mine and will do that conversion and launch QCacheGrind. pyprof2calltree is needed for this script to run and it can be installed via pip install pyprof2calltree.
#!/bin/bash

PROF_FILE=$(basename "$1")
PROF_DIR=$(dirname "$1")
echo $PROF_DIR
PROF_DIR="${PROF_DIR:-.}"
CACHEGRIND_FILE="callgrind-${PROF_FILE}"

pyprof2calltree -i "${PROF_DIR}/${PROF_FILE}" -o "${PROF_DIR}/${CACHEGRIND_FILE}"
qcachegrind "${PROF_DIR}/${CACHEGRIND_FILE}"
This script takes a single argument which is the output of the previous step.
./profile profile.out
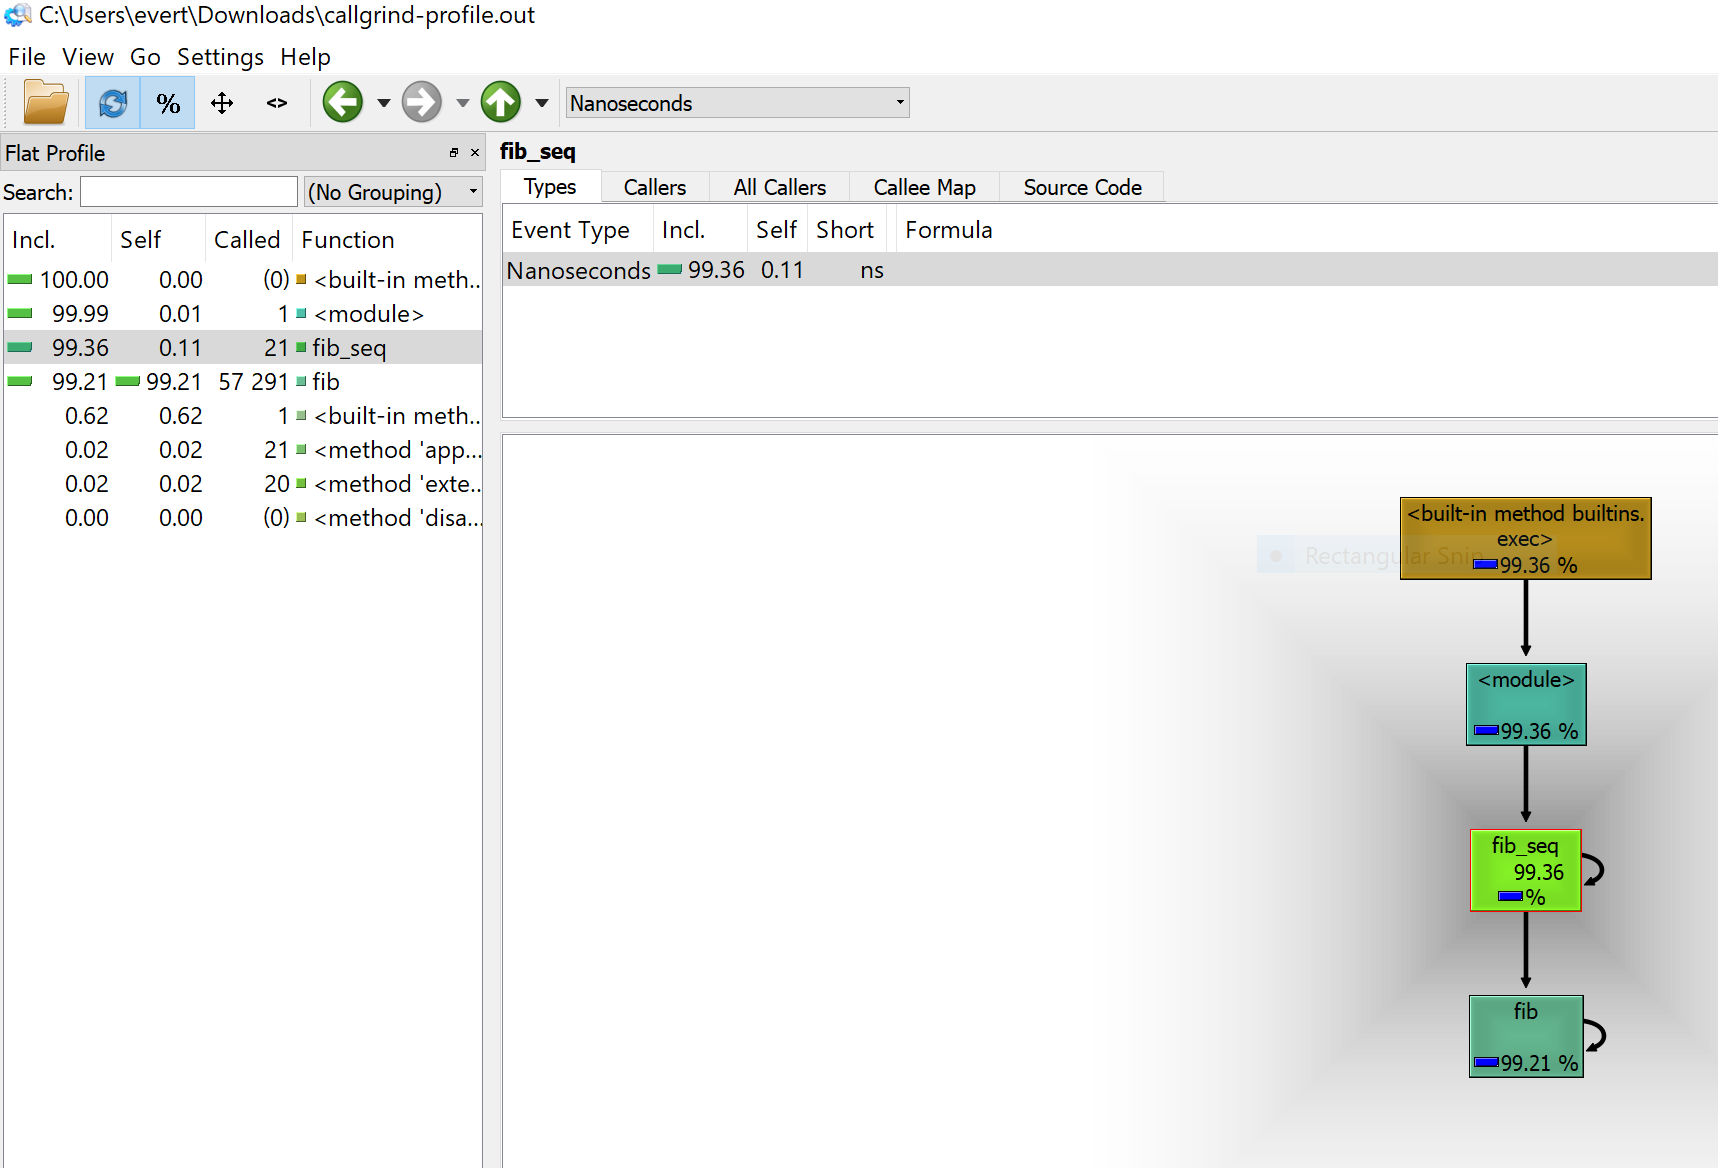
And that’s all there is to it. Overall, QCacheGrid is a very useful tool for finding bottlenecks and performance issues and this simple script nicely ties it into Python.